Röstigraben Applied data analysis of swiss votation patterns
Clustering of municipalities by decades
Introduction
This post is mainly an extension of the previous post on the clustering of the municipalities using the votation dataset. In this is post we are going to see what happens when we consider timeframes of 10 years using the exact same methods. Please be sure to have read the previous post before this one. A concern we raised in the previous post is the fact that the Röstigraben may have been shown by strong components in specific decades which would not be representative of a more recent era. It is also often reported in the medias that a new kind of split appears in Switzerland which is differences in voting behavior between cities and countryside. We will investigate this claim in this post.
The timeframes considered are the different decades, i.e., 1981 to 1989, 1990 to 1999, 2000 to 2009 and 2010 to 2017.
Maps (results) for K-means and DBSCAN
Analysis and discussion
As a preliminary remark, it has to be said that drawbacks and advantages of both methods (K-means and DBSCAN) have alredy been explained in the previous post. Note especially it is still true that K-means and DBSCAN are not aware of any geographical structures or linguistic features as we used them (i.e., only with votations data).
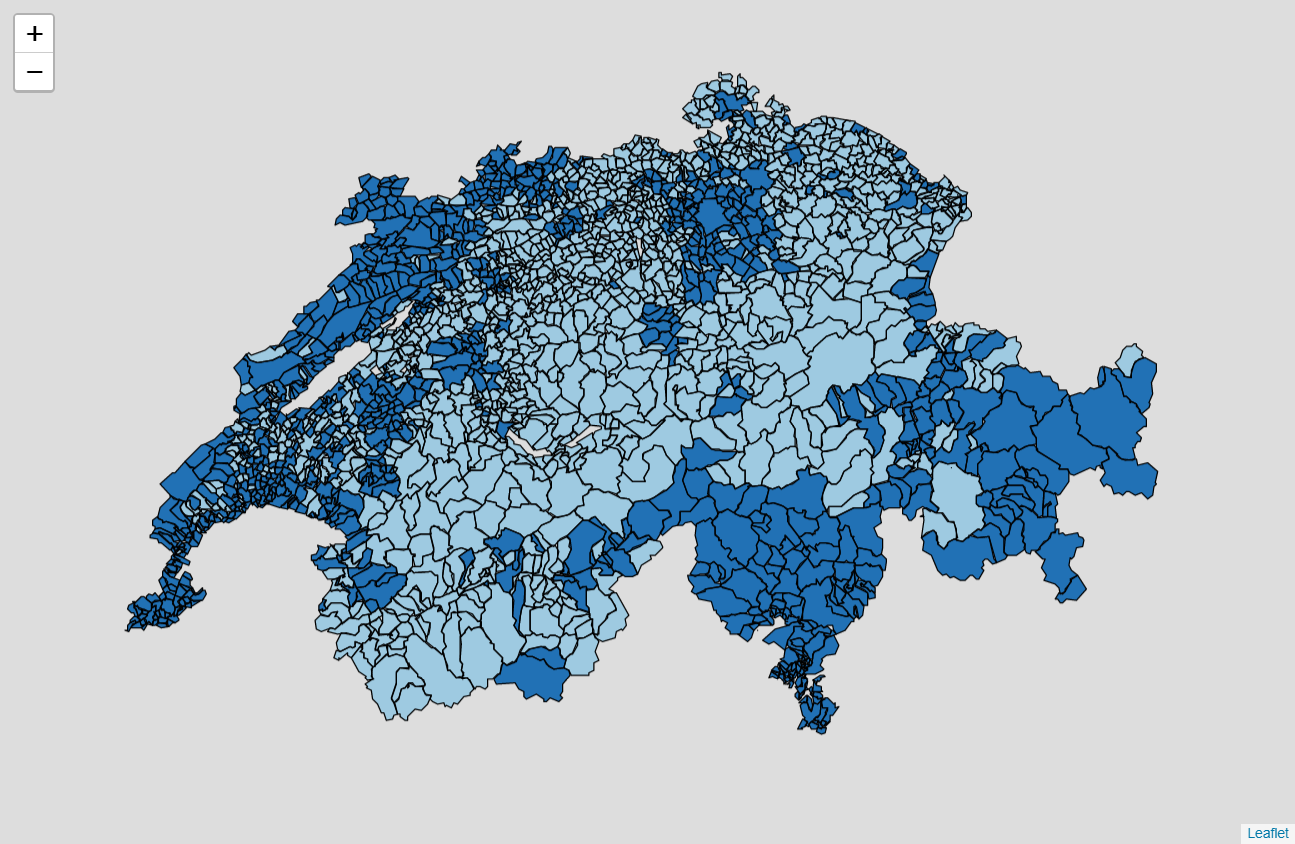
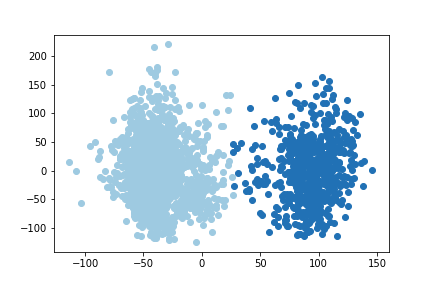
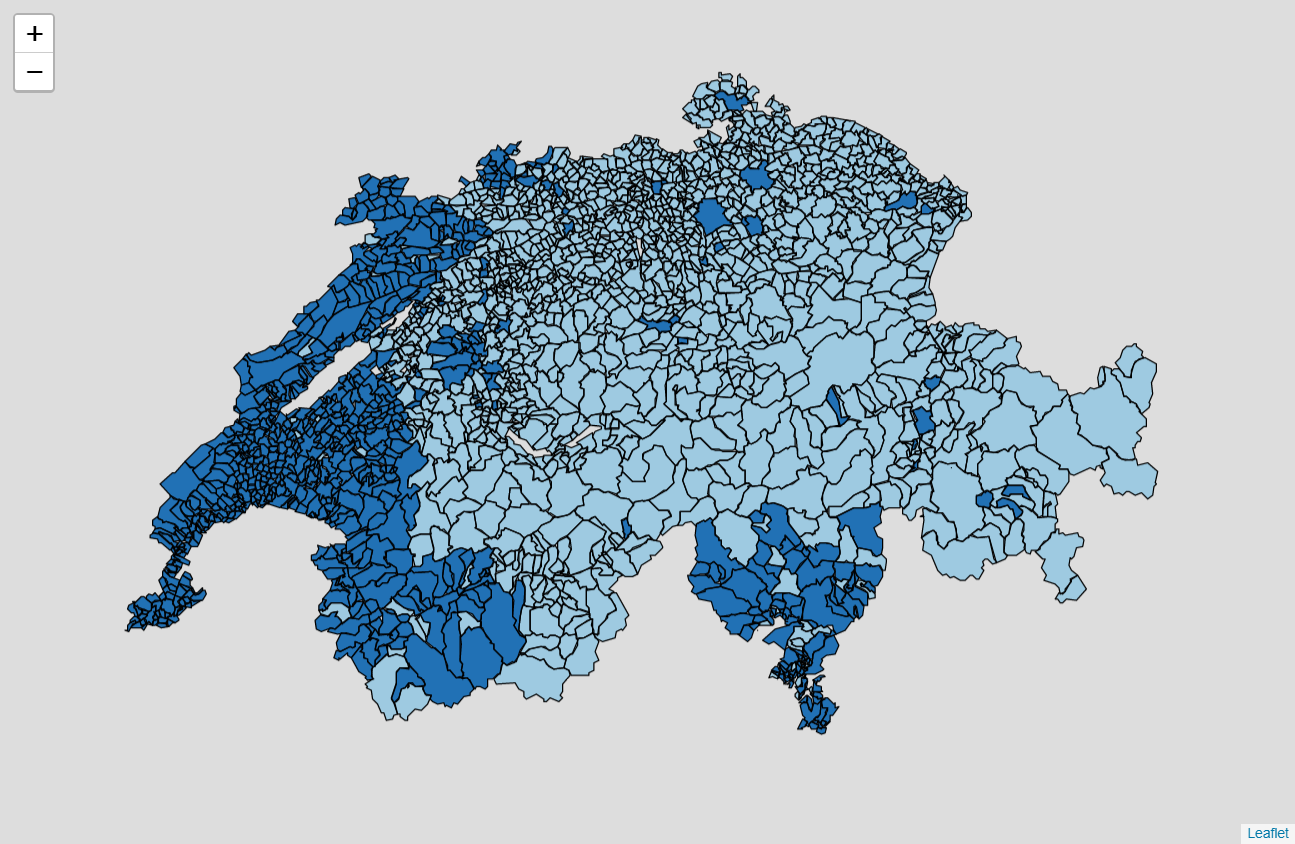
K-means, two clusters
In the first time period, from 1981 to 1989, we can see results which much more mitigated. We see Geneva, Vaud, Neuchâtel, the French speaking Fribourg, Basel, Ticino, Grisons, plus some Swiss German cities and their suburbs (Zurich, St. Gallen, Bern) in one cluster. While the second cluster is mainly composed of the coutryside of the German speaking area of the country. It is important to note that few municipalities in the countryside of Vaud are clustered with the German speaking countryside. Even if we can guess one, it would be necessary to make further analysis (like taking each theme individually) to know if a Röstigraben truly exists.
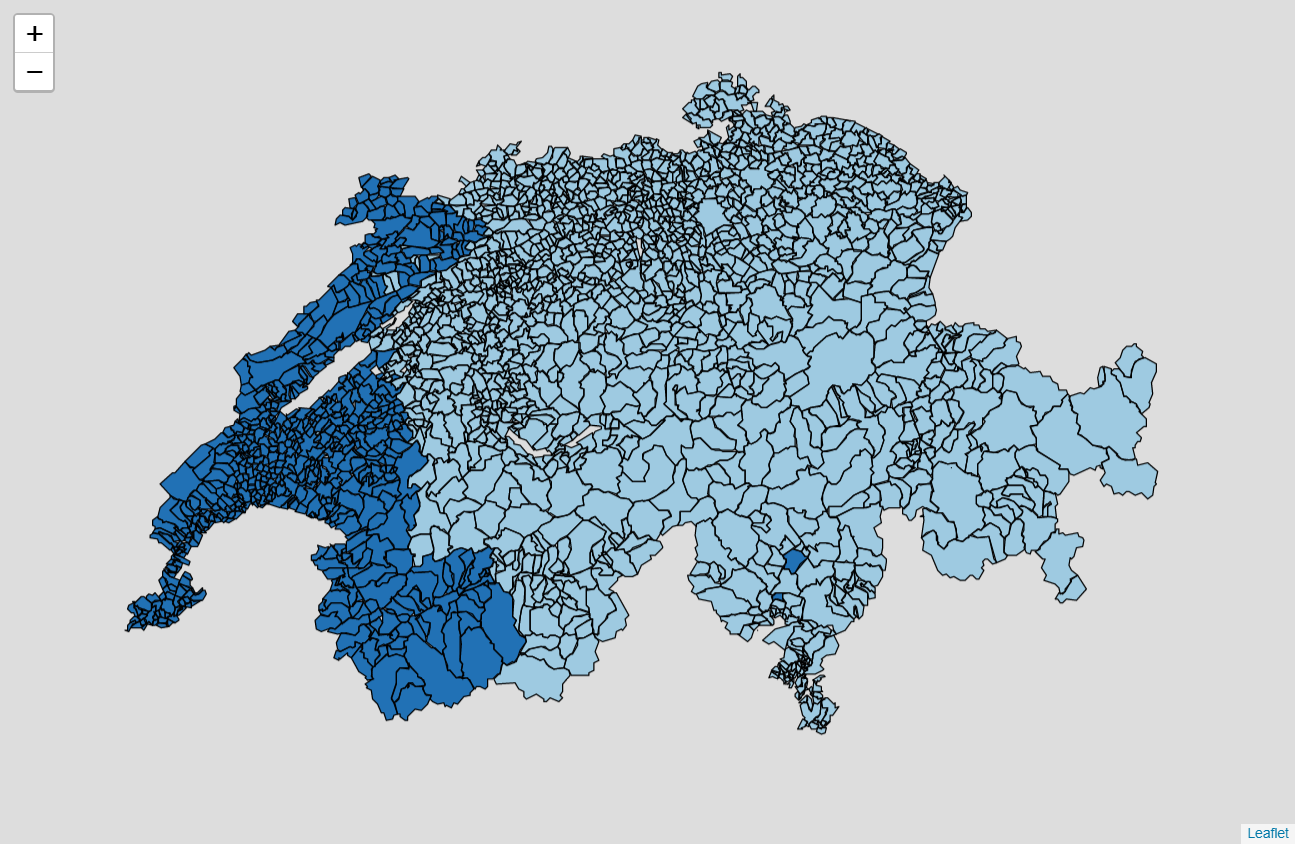
Regarding the next decade, we see a very strong result. The Romandy represents one cluster and the other regions of Switzerland the second cluster. Again, we would like to remind the reader that the algorithm has no awarness of any geographical/linguistic features. This result makes us think of the results we obtained in the previous post and it suggests that this decade influenced our results with stronger components.
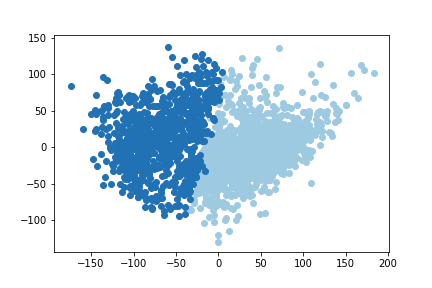
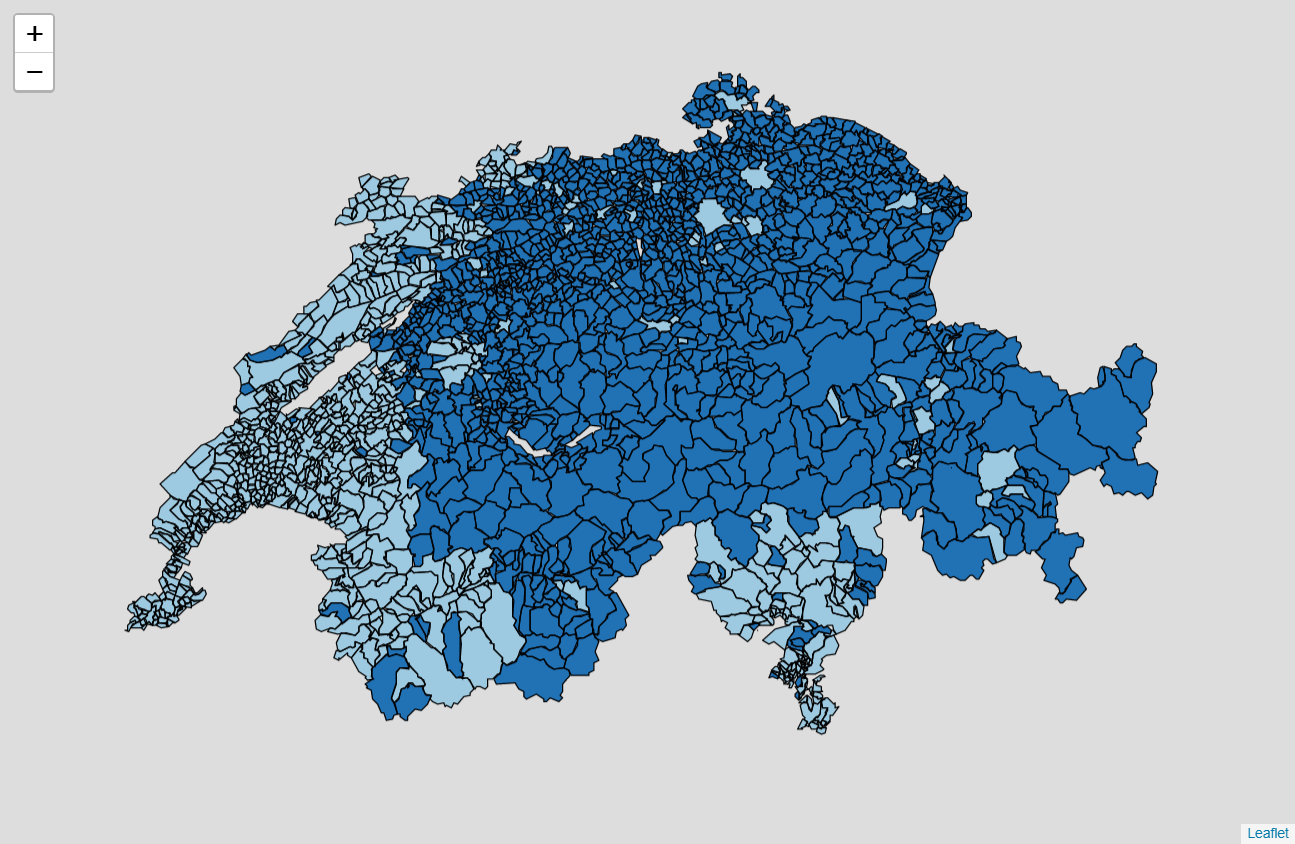
For the last two decades, the results are similar. The German speaking cities (Bern, Basel, Zurich, St. Gallen and Winterthur) and Ticino join the Romandy in the same cluster. The German speaking countryside representing the second cluster. This result is interesting for two reasons. First, the Röstigraben is still something actual. Secondly, a split between cities and countryside in the German speaking part of the country is truly happening, and this trend dates back to 20 years.
K-means, three clusters
In the first decade, from 1981 to 1989, results are again quite mitigated and it is difficult to see any strong pattern coming from the map. In the 90s, results are very similar with what we got in the previous post considering all the timeframe at once (we begin to see that this decade may have been of strong political divide between Romandy and the German speaking part of the country).
Considering the last 20 years, the trend identified with two clusters is confirmed. The difference is that the suburbs of the German speaking cities, Ticino, Grisons are now classified with the cities, Romandy as one cluster and the German coutryside representing the last cluster. Clearly, the countryside of the German part stands apart from the cities in the recent votations.
K-means, four (and five) clusters
From 1981 to 1989, we see a pattern appearing with Ticino standing with Jura in one cluster, Vaud and Neuchâtel taking a second cluster and then the populated area of the German side classified together with Grisons. A cluster is taken by Valais and the countryside of the German part. The classification does not suggest the existence of a Röstigraben.
In the 90s, the classification is once again quite similar to what we get considering the whole timeframe with the Romandy divided onto two clusters. Ticino (and the German speaking Valais) in another cluster, the two other being the populated area of the German speaking municipalities together with Grisons and the German speaking countryside in the last cluster.
In the last 20 years, we see the Romandy together with the municipality of Zurich onto two clusters, the German speaking cities together with Grisons in another one, Ticino having its own cluster and the German coutryside being classified in the last one. This shows again a modern split between urban areas together with Romandy and the German countryside having its own voting pattern. It is interesting to note how Ticino takes one cluster of its own.
DBSCAN
For the first decade, we did not manage to get a good result as we obtain a single cluster with outliers. Interestingly, for the three other decades the results are very similar between them, but also with our analysis over a single period of time. Please refer then to the previous post for the discussion.
Conclusion
It is quite difficult to see any meaningful in the data during the first decade from 1981 to 1989. This time period does not suggest any Röstigraben, whatever the number of clusters considered.
In the last 20 years, we clearly observed a trend for countryside and cities voting differently. Also the Romandy tends to take two clusters suggesting a less unite front.
It is interesting to note that Ticino often represents a single cluster and is sometimes classified with the French part or the German part equally. Then, Ticino may be of great importance for some votations as they have a position suggesting they can take the outocome of a votation with them to one side or the other.